Quality Assurance Monitoring & Reporting
AI enhanced software for call centres
Customisable. Powerful.
An all-in-one solution for QA teams and call centre managers
Custom Scorecards
Easy to use scorecard building tool
Determine call quality with precision using a wide range of options and scoring behaviours.
Save time, be consistent
Use our scorecard templates or create your own.
In-depth Reports
Bring your data to life
Extensive reporting capabilities. Create custom reports to target the metrics you have applied to your scorecards.
Explore a variety of reporting methods
Use our in-built reports to easily drill down on scorecard section focus areas, QA staff performance, calibration scores, and trend analysis.
Calibration Centre
Rich team insights
Develop your Quality Assurance team through calibration sessions and track variances within your team using our calibration tools.
Unified message
You can invite agents and their managers to join in, ensuring consistency across all levels of the business.
AI Powered Analysis
Intelligent contact selection
Let our AI analyse your text contacts to determine which ones require the most attention.
Increased effectiveness
Leveraging AI takes the randomness out of contact selection for a more effective approach to monitoring.
Risk Analysis
Identify risk factors sooner
We calculate the risk level of all your scorecard sections.
A comprehensive approach
Our algorithm looks at current performance, historic trends, scoring behaviours, and evaluation volumes.
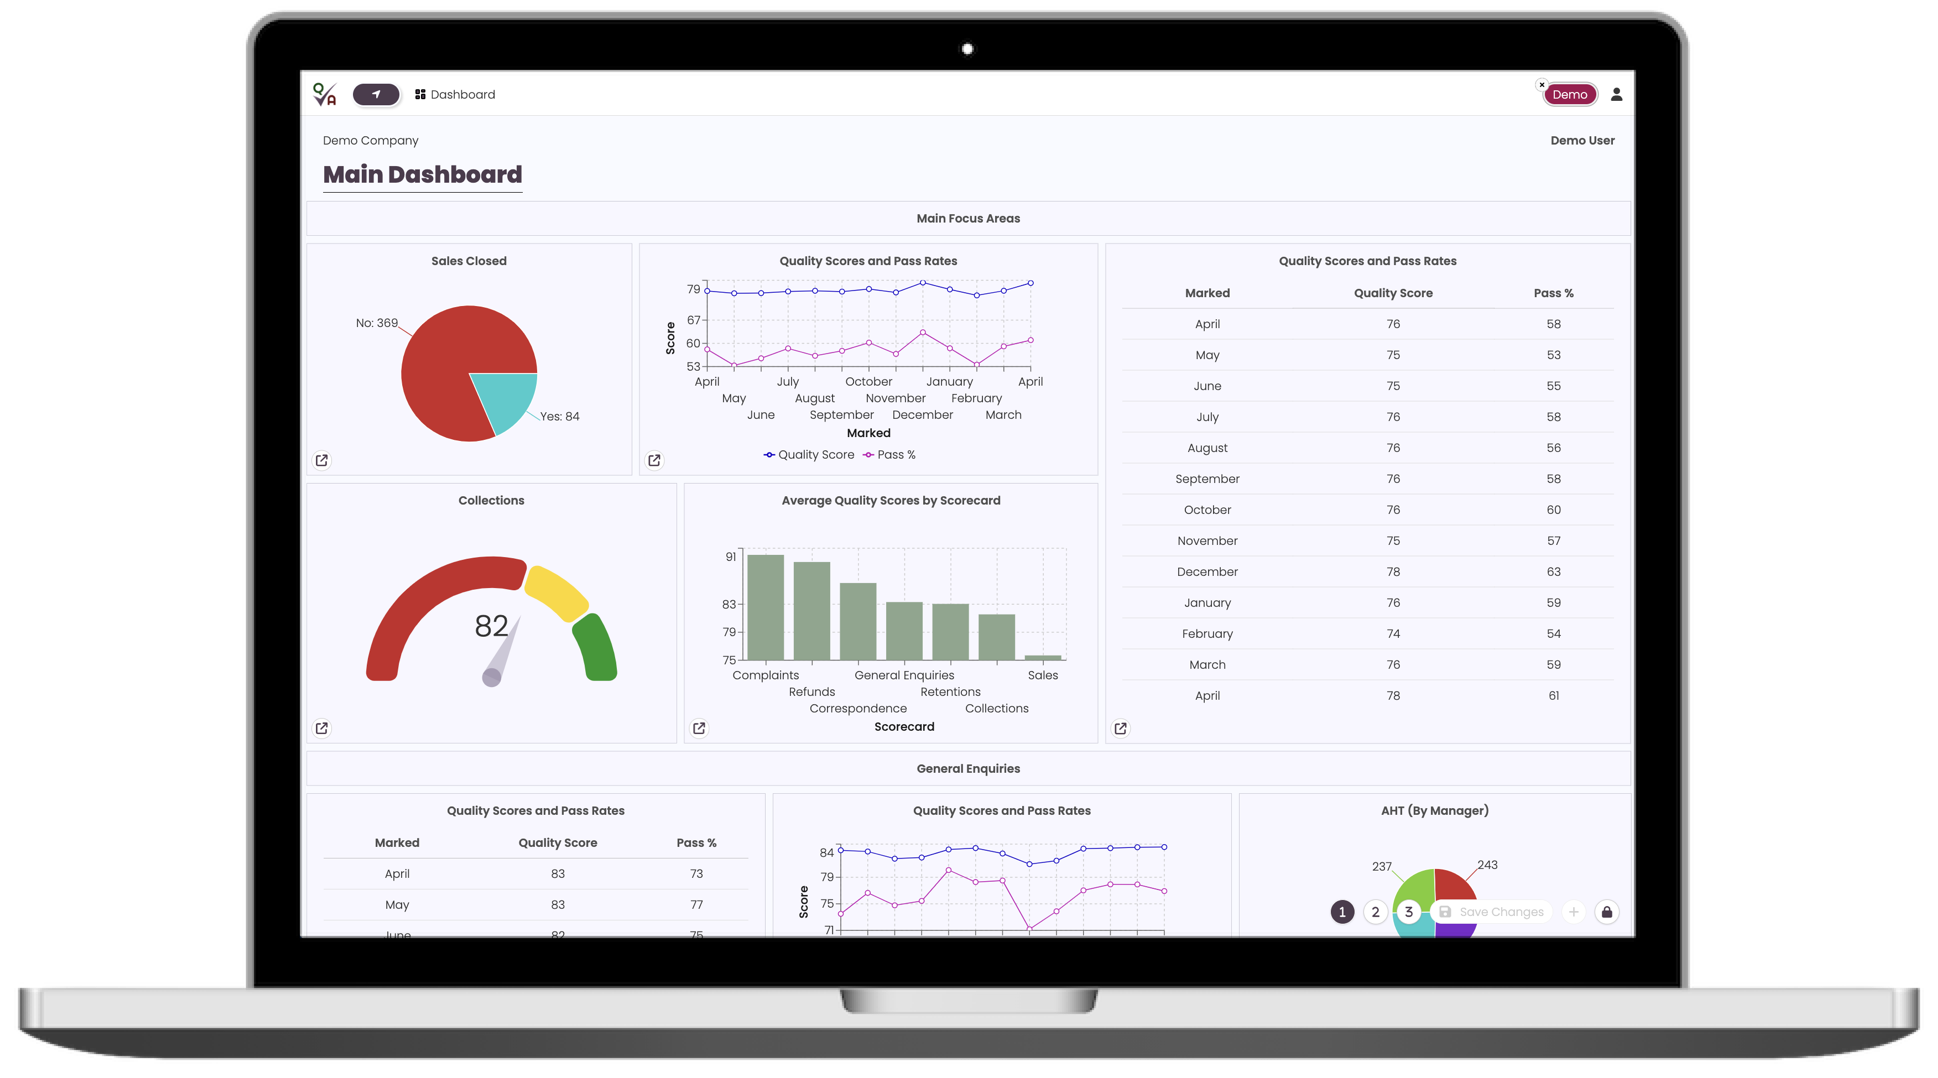
Personalised Dashboards
Clear and immediate overviews
Create dashboards with your custom reports to keep up to date with key focus areas and developing trends.
Alternate between priorities
Every user can create up to 3 separate customisable dashboards.
Easy Integration
Effortlessly transition to QA Portal
Import your existing evaluations, staff lists, and users.
Export your portal data. Print/save evaluations, scorecards, and reports.
Branding
Personalise your portal experience
Apply company branding for a professional look.
Replace the QA Portal logo with your company logo in the nav bar. Apply your logo and company name to scorecards and evaluations.
Optimized & Accessible
On any device
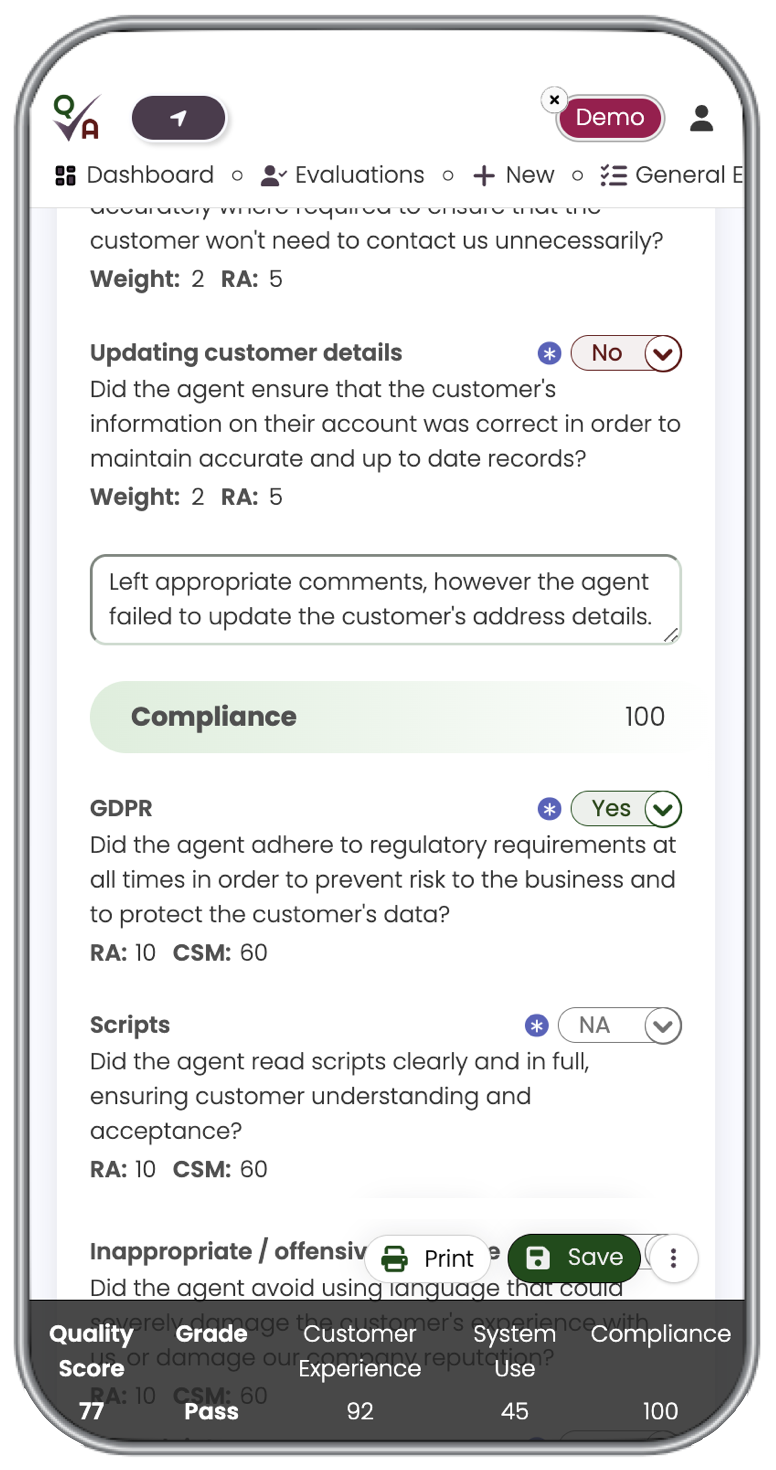
We've built the QA Portal to be accessible regardless of screen size.
So whether you're in the office at a monitor, in a meeting with a tablet, or out and about on your smartphone, your content will adapt accordingly.
Scoring
Start by crafting effective scorecards
Creating customised flexible scorecards is easy. Our scorecard building tool is fast and responsive and there is no limit to the number of scorecards you can create.
We have a range of scoring options that will empower you to create the metrics you need in order to drive performance and boost customer satisfaction.
Feedback
Get the best out of your staff and set them and the business up for success
Giving quality coaching to agents is straightforward with our scorecards and reporting tools. Prep for a feedback session by accessing an agent's key development areas and top sections.
With a clear breakdown of performance and how scores are calculated, you can be transparent in giving agents the coaching they need to identify and overcome their development areas and realise their potential.
Reporting
Take advantage of our full suite of reports and customise your own
Compiling reports based on your evaluations doesn't need to be a difficult or time consuming task. Our reports are thorough in their insight and allow for drilling down on the key areas of your choice.
Fill your dashboard with custom reports in order to see an overview of everything that is important to you as soon as you log in. Then deep dive into specific areas.
Calibration
Gain insight into the variances within your team
Our post calibration analysis shows a breakdown of variances across all metrics, highlighting the different ways your QA team judge situations.
Drill down on specific areas and view trends over time to make sure your QA team is heading in the right direction.
QA Portal
Call the shots
on quality
Customisable and flexible, QA Portal is about freedom.
Empowering you to enhance customer interactions and operational efficiency, driving performance and customer satisfaction.
Streamlining the quality assurance process, QA Portal leverages AI to enhance call monitoring effectiveness.
Other robust features include scorecard creation, insightful reporting, and team calibration.
At your desk...
...in a meeting...
...on the go
Accessible on all devices. So you can always get the information you need.
With new features being added all the time, use QA Portal to unlock the full potential of your call centre's quality assurance efforts.
Take a closer look at some of the key features below:
Scorecards
Highly customisable with most features being optional
Set pass marks
Set Red / Amber / Green (RAG) boundaries
Apply logos and company names to your scorecard banners
Utilise custom marking choices (eg. Pass/Fail, Yes/No, etc)
Give scorecards a description
Add admin sections as well as scoring sections
Give admin secitons a type (eg. number, date, text, etc)
Group your scorecard sections into categories
Place additional comments boxes on your scorecards
Create data lists that can be used as drop down options within your scorecard admin area
Give scoring sections a description
Choose any combination of weight / RA / CSM for calculating scores
Weight: Apply weight to sections, with the amount depending on the impact you want those sections to have on the overall quality score.
RA: Reduction Amount - a fixed amount by which the final score of the evaluation will be reduced if the section is failed.
CSM: Call Score Maximum - if the agent fails one of these sections, the maximum quality score for the evaluation will be limited to the amount you have set.
Set individual admin / scoring sections as mandatory or optional
Save and load default settings
Save as draft or set the status to inactive if you don't want the scorecard to be available right away
Save or print a printer friendly PDF version
Scorecard templates
Create templates to aid adding future scorecards
Use your existing scorecards as templates
Take advantage of the QA Portal preset templates
Reports
Built-in reports
Hot Topics: Track selected sections from each scorecard over a 12 week period.
Focus: Allows for an in-depth analysis of the results from scorecard sections and categories.
Risk: We calculate the risk level associated with all of your scorecard sections and rank them.
QA: Monitor evaluation volumes by scorecard and QA staff, as well as feedback volumes and trends.
Calibrations: Analyse QA variances and trends across scorecards, with the ability to drill down on individual section and category variances.
Build custom flexible reports
Report on any of the parameters you have created within your scorecards, and filter, aggregate, group, and sort the data however you please
Add charts to you reports
Bar / Line / Pie / Needle / Area / Scatter
Customise the features and look of your charts
Legend / Labels / Size / Y axis label / X axis label
Select the colours of bars / lines / areas / scatter points
Choose the parameters and RAG boundaries of needle charts
Most report charts display additional data when hovered over
Set / restrict access to your reports for other portal users
Choose custom column names (and change the column order) of your report results
Give your reports a name and description
Calibrations
Invite any portal user to participate in a calibration, regardless of their role
Choose calibration type
Benchmark: The results will be calculated based on the variance between the participants' evaluations and the benchmark evaluation (this will be completed by the calibration host).
Group Average: The results will be calculated based on the variance between the participants' evaluations and the average results of all participants' evaluations combined.
Enter calibration details to provide participants with useful information, eg. where to locate the call the group will be listening to
Track which participants have submitted their calibration evaluations
The host can lock calibrations to prevent further submissions or edits, and then share the results when ready
Review the results of individual calibrations, and view a dedicated built-in calibration report with various options for drilling down on the results
Risk Analysis
Risk analysis report built-in
Filter by which scorecards you want to see risk data for
Risk scores are used along with other factors in calculating an agent's 'Top Sections' and 'Development Areas'
Calculation of risk scores uses a combination of the section's pass %, the weight, RA, and/or CSM applied to the section, and how frequently it has been marked as applicable on evaluations
Dashboard
Create up to 3 personalised dashboards
Design your dashboards to fit with the screen sizes of the devices you will typically be using
Wide screens - Dashboard 1 will open by default
Small screens - Dashboard 2 will open by default
Give your dashboards a title
Drag and resize dashboard elements
Select header text for dashboard elements
Select table / chart data for dashboard elements
Where report data is being used in a dashboard element, a link to the original report will be available from the element
Hover over most charts for further detail
AI Powered Analysis
QA Portal can scan up to 100% of your text contacts, with call scanning in the pipeline.
We use AI to determine which of your contacts require the most urgent attention
Our AI scans for trigger words (which you can set) to determine which contacts should be recommended for monitoring
Contact selection no longer needs to be random
Integration
Import your existing data into the portal
Evaluations / Agents / Users
We provide templates for importing data
We can help format your import data if you require any assistance
Import in CSV file format
Export data from any of the main data grids in csv format
Branding
Upload your company logo and it will be displayed on the navigation bar instead of the QA Portal logo for all users
Your company name will appear on the navigation bar and within the navigation screen for all users
Logos and company names will appear in your users' account areas
Scorecards can be personalised with your company name and logo
You have the freedom to choose alternative branding for individual scorecards, or you can set your brand defaults and use the same details for each scorecard you create


